To save a plot with matplotlib:
- Create a plot.
- Give a name to the plot.
- Call the matplotlib.pyplot.savefig() and pass the name as an argument.
plt.savefig('myplot')
Here is an example where the script saves a plot to the same folder:
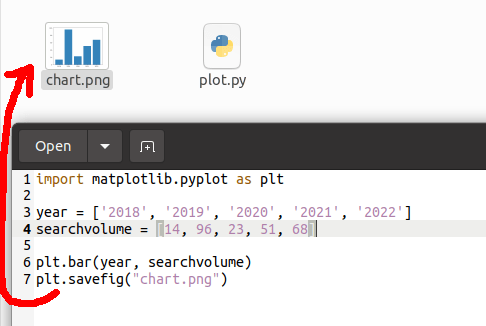
To conveniently test this piece of code yourself, here is the code:
import matplotlib.pyplot as plt

year = ['2018', '2019', '2020', '2021', '2022']
searchvolume = [14, 96, 23, 51, 68]

plt.bar(year, searchvolume)
plt.savefig("chart.png")
This is how easy it is to save plots with matplotlib.
However, I recommend checking these tips when it comes to saving plots with matplotlib.
Tips for Using the savefig() Function
Here are three tips for making saving matplotlib figures more seamless.
Tip 1: Specify the File Format
When saving a plot, you can specify the saved image type by specifying the file extension in the argument.
For instance:
plt.savefig('example.pdf')
plt.savefig('example.png')
Here are all the supported formats:
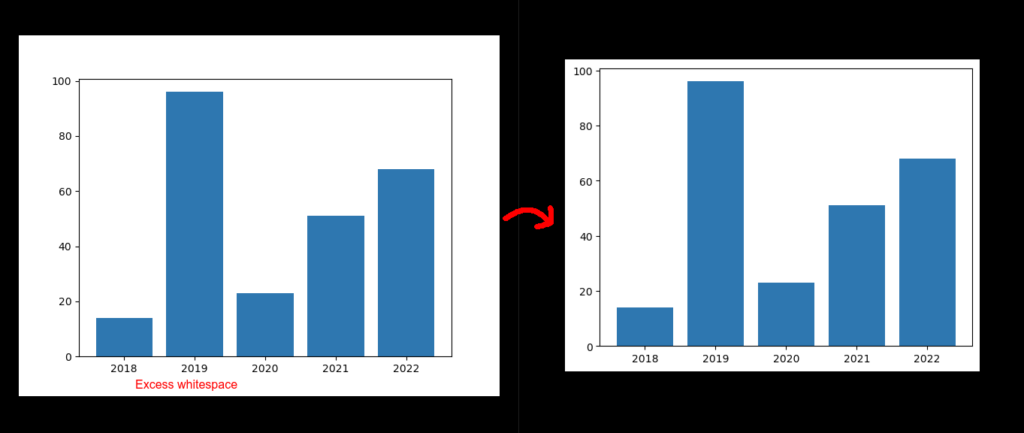
Tip 2: Remove Excess Whitespace
More often than not, there is excess unused space around the plotted image.
You can get rid of the excess whitespace by making the bounding box tight by:
plt.savefig('example.png', bbox_inches='tight')
Here you can see a comparison. The figure on the left has a lot of excess white space. But when the bbox_inches is set ‘tight’, the excess white space is gone.
Tip 3: Do Not Leave the Plots Open by Accident
In some cases, in addition to saving the plot, it is also opened up regardless of whether you requested showing it.
If you are creating and saving tons of figures, you definitely do not want to leave them open.
To avoid leaving the matplotlib figures open, you can use the matplot.pyplot.close() function on the figure.
plt.close(fig)
For instance:
import matplotlib.pyplot as plt

fig, ax = plt.subplots(nrows=1, ncols=1)
ax.plot([0, 1, 2, 3], [5, 7, 3, 8])
fig.savefig('example2.png')

plt.close(fig)
Conclusion
Today you learned how to save a plot with matplotlib.
To recap, use the matplotlib.pyplot.savefig() function by specifying the name of the plot file as the argument.
Thanks for reading.
Happy coding!