In mathematics, random walk is the process in which objects randomly wander away from where they started.
Here is a video that shows how a particle collides with other particles in two dimensions. The path of the yellow particle is described by random walk:
Random walk is easy to visualize using Python. Here are illustrations of random walks in 1D, 2D, and 3D:
Today you learn how to plot these three graphs by implementing the random walk algorithm in Python.
Why Is Random Walk Useful
Randomness is always present in nature.
When you drop a droplet of the colorant into a glass of water it mixes up automatically without you stirring it.

But how and why does this happen?
Water molecules in the glass vibrate rapidly on a microscopic level. When the colorant molecules collide with the rapidly vibrating water molecules, they bump around in random directions. This eventually mixes the water and the colorant and makes it an evenly colored mix.
If you take one colorant molecule under inspection, you can see its path is completely random. This is because it collides with the water molecules that are vibrating in random directions. If you want to simulate a colorant molecule in a glass of water, you would do it with a random walk.
The random walk algorithm is useful as it can be used to simulate common phenomena of nature.
How to Implement Random Walk in Python
The random walk can be easily implemented in Python. A great starting point is to start with the 1D random walk.
To make the one-dimensional random walk work:
- Initialize an object at position y.
- Randomly move the object up or down. In other words, add or subtract 1 from the y value.
- Keep track of all the positions of the object, that is, the y values.
Then, to implement 2D and 3D random walks, expand this idea into 2 and 3 dimensions.
Disclaimer: This post contains affiliate links.
Prerequisites
The random walk algorithm itself can be implemented natively in Python. But you need to use a library to visualize the results plus some utilities for generating lists of numbers.
In this guide, you are going to use these two external packages:
- NumPy for generating lists of numbers.
- Matplotlib for plotting the results of each random walk.
To work with these packages, you need to have them installed on your machine. You can install these with Pip by running the following command in your command line window:
pip install numpy
pip instal matplotlib
Now you are all set. Let’s get started with the random walks.
1D Random Walk
The most basic random walk is the 1D random walk. In this form of random walk, the moving object is restricted to moving in one dimension only. In our case, up and down.
The idea is that the object takes a step up or down randomly n times and stores the position values into a list.
Because the movement of the object is one-dimensional, the graph that illustrates the path is a line of some height. This is not useful, because it is impossible to tell where the object was at each step. To make the graph more informative, we are going to assign a timestamp for each step. This makes it a 2D graph with the object’s position on the y-axis and the timestamp on the x-axis.
Here is the function that implements the 1D random walk with n time points. Please, take a look at the comments in the code. Also, this is not the most elegant implementation but it is the easiest to understand:
import numpy as np
import matplotlib.pyplot as plt
import random

def randomwalk1D(n):
    x, y = 0, 0

    # Generate the time points [1, 2, 3, ... , n]
    timepoints = np.arange(n + 1)
    positions = [y]

    directions = ["UP", "DOWN"]
    for i in range(1, n + 1):

        # Randomly select either UP or DOWN
        step = random.choice(directions)

        # Move the object up or down
        if step == "UP":
            y += 1
        elif step == "DOWN":
            y -= 1

        # Keep track of the positions
        positions.append(y)

    return timepoints, positions
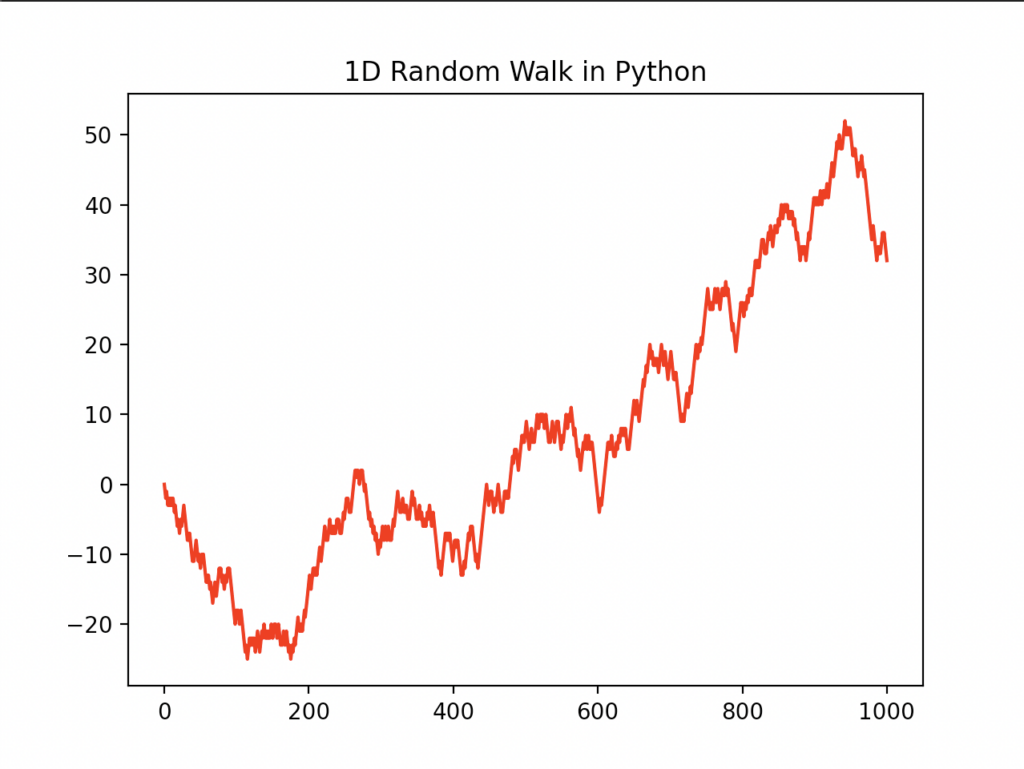
Now you can create a random walk and plot the timepoints as the x-axis and the position of the object as y-axis:
time_data, pos_data = randomwalk1D(1000)

plt.plot(time_data, pos_data, 'r-')
plt.title("1D Random Walk in Python")
plt.show()
Output:
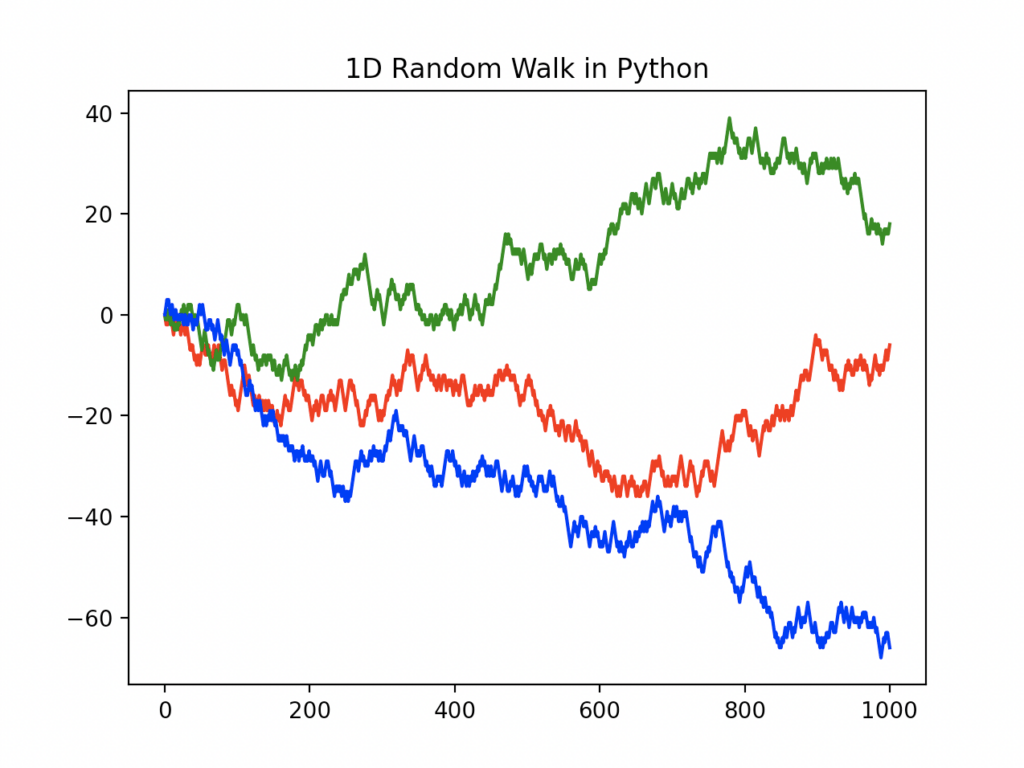
To make a comparison, you can plot multiple results of 1D random walks into the same graph:
rw1 = randomwalk1D(1000)
rw2 = randomwalk1D(1000)
rw3 = randomwalk1D(1000)

plt.plot(rw1[0], rw1[1], 'r-', label="rw1")
plt.plot(rw2[0], rw2[1], 'g-', label="rw2")
plt.plot(rw3[0], rw3[1], 'b-', label="rw3")

plt.show()
Output:
Full Code
import numpy as np
import matplotlib.pyplot as plt
import random

def randomwalk1D(n):
    x, y = 0, 0

    # Generate the time points [1, 2, 3, ... , n]
    timepoints = np.arange(n + 1)
    positions = [y]

    directions = ["UP", "DOWN"]
    for i in range(1, n + 1):

        # Randomly select either UP or DOWN
        step = random.choice(directions)

        # Move the object up or down
        if step == "UP":
            y += 1
        elif step == "DOWN":
            y -= 1

        # Keep track of the positions
        positions.append(y)

    return timepoints, positions

rw1 = randomwalk1D(1000)
rw2 = randomwalk1D(1000)
rw3 = randomwalk1D(1000)

plt.plot(rw1[0], rw1[1], 'r-', label="rw1")
plt.plot(rw2[0], rw2[1], 'g-', label="rw2")
plt.plot(rw3[0], rw3[1], 'b-', label="rw3")

plt.show()
Now that you know how to implement the random walk algorithm in 1 dimension, let’s move on to higher dimensions.
2D Random Walk
The idea behind the random walk in 2D is the exact same as in one dimension. Now the movement of the object is no longer restricted to up/down. Instead, it can move to the left or right too.
In the 2D case, you are not plotting against time anymore. Instead, it is possible to visualize the walk by plotting the x, and y coordinate pairs into the graph. This draws the 2D path the object took with n steps.
Here is how the algorithm looks in the code:
import numpy as np
import matplotlib.pyplot as plt
import random

def randomwalk2D(n):
    # [0, 0, 0, ... ,0]
    x = np.zeros(n)
    y = np.zeros(n)

    directions = ["UP", "DOWN", "LEFT", "RIGHT"]
    for i in range(1, n):
        # Pick a direction at random
        step = random.choice(directions)

        # Move the object according to the direction
        if step == "RIGHT":
            x[i] = x[i - 1] + 1
            y[i] = y[i - 1]
        elif step == "LEFT":
            x[i] = x[i - 1] - 1
            y[i] = y[i - 1]
        elif step == "UP":
            x[i] = x[i - 1]
            y[i] = y[i - 1] + 1
        elif step == "DOWN":
            x[i] = x[i - 1]
            y[i] = y[i - 1] - 1

    # Return all the x and y positions of the object
    return x, y
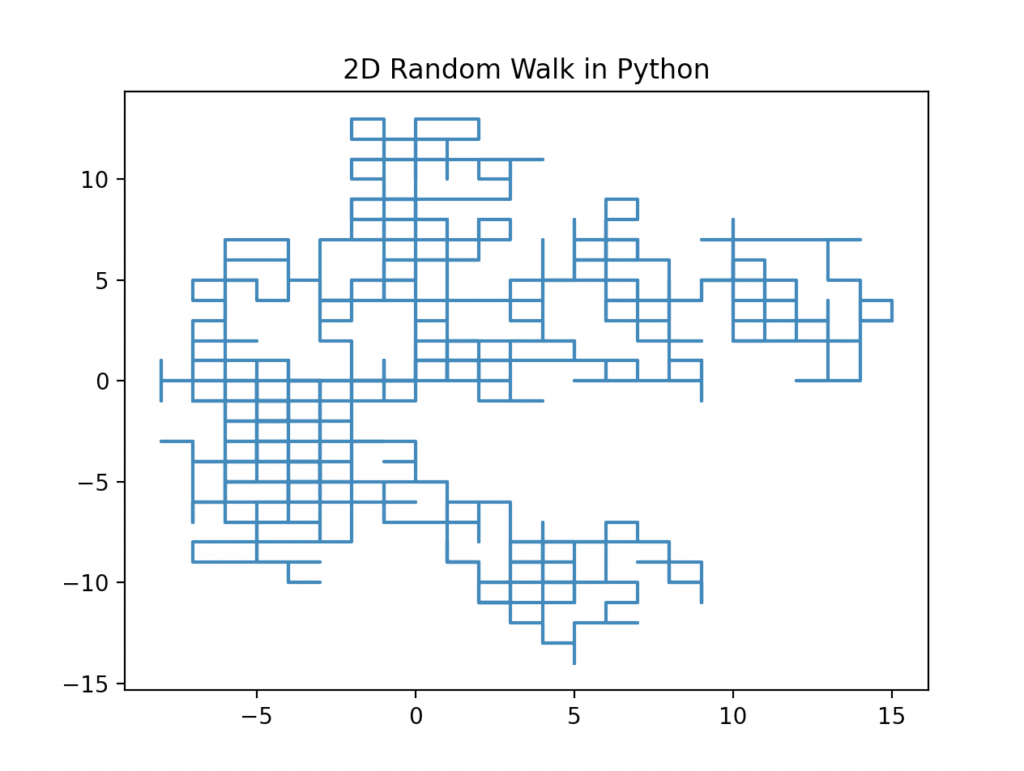
Here is an example run of a 2D random walk with 1000 steps.
x_data, y_data = randomwalk2D(1000)

plt.title("2D Random Walk in Python")
plt.plot(x_data, y_data)
plt.show()
Here is a path that the above code produces:
Full Code
import numpy as np
import matplotlib.pyplot as plt
import random

def randomwalk2D(n):
    # [0, 0, 0, ... ,0]
    x = np.zeros(n)
    y = np.zeros(n)

    directions = ["UP", "DOWN", "LEFT", "RIGHT"]
    for i in range(1, n):
        # Pick a direction at random
        step = random.choice(directions)

        # Move the object according to the direction
        if step == "RIGHT":
            x[i] = x[i - 1] + 1
            y[i] = y[i - 1]
        elif step == "LEFT":
            x[i] = x[i - 1] - 1
            y[i] = y[i - 1]
        elif step == "UP":
            x[i] = x[i - 1]
            y[i] = y[i - 1] + 1
        elif step == "DOWN":
            x[i] = x[i - 1]
            y[i] = y[i - 1] - 1

    # Return all the x and y positions of the object
    return x, y

x_data, y_data = randomwalk2D(1000)

plt.title("2D Random Walk in Python")
plt.plot(x_data, y_data)
plt.show()
3D Random Walk
Now that you have the 1D and 2D random walks working, let’s finally implement the 3D one.
The idea is exactly the same as in 2D, but now you can move up/down, left/right, and also inward/outward.
Here is how the algorithm looks in the code:
import matplotlib.pyplot as plt
import numpy as np
import random

def randomwalk3D(n):
    x, y, z = np.zeros(n), np.zeros(n), np.zeros(n)

    directions = ["UP", "DOWN", "LEFT", "RIGHT", "IN", "OUT"]
    for i in range(1, n):
        step = random.choice(directions)

        if step == "RIGHT":
            x[i] = x[i - 1] + 1
            y[i] = y[i - 1]
            z[i] = z[i - 1]
        elif step == "LEFT":
            x[i] = x[i - 1] - 1
            y[i] = y[i - 1]
            z[i] = z[i - 1]
        elif step == "UP":
            x[i] = x[i - 1]
            y[i] = y[i - 1] + 1
            z[i] = z[i - 1]
        elif step == "DOWN":
            x[i] = x[i - 1]
            y[i] = y[i - 1] - 1
            z[i] = z[i - 1]
        elif step == "IN":
            x[i] = x[i - 1]
            y[i] = y[i - 1]
            z[i] = z[i - 1] - 1
        elif step == "OUT":
            x[i] = x[i - 1]
            y[i] = y[i - 1]
            z[i] = z[i - 1] + 1

    return x, y, z
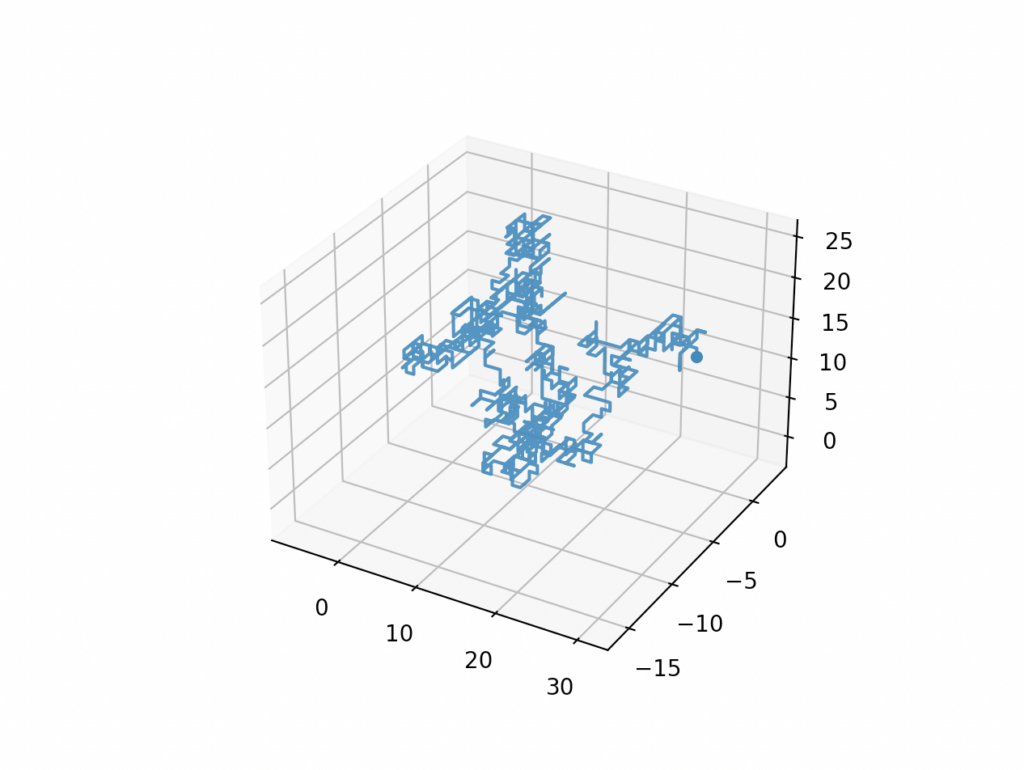
And here is an example of a 3D random walk with 1000 steps plotted in a 3D interactive graph:
x_data, y_data, z_data = randomwalk3D(1000)

ax = plt.subplot(1, 1, 1, projection='3d')
ax.plot(x_data, y_data, z_data, alpha=0.9)
ax.scatter(x_data[-1], y_data[-1], z_data[-1])

plt.show()
Output:
If you run this code on your machine, you can freely rotate the resulting graph to inspect it in other directions.
Full Code
import matplotlib.pyplot as plt
import numpy as np
import random

def randomwalk3D(n):
    x, y, z = np.zeros(n), np.zeros(n), np.zeros(n)

    directions = ["UP", "DOWN", "LEFT", "RIGHT", "IN", "OUT"]
    for i in range(1, n):
        step = random.choice(directions)

        if step == "RIGHT":
            x[i] = x[i - 1] + 1
            y[i] = y[i - 1]
            z[i] = z[i - 1]
        elif step == "LEFT":
            x[i] = x[i - 1] - 1
            y[i] = y[i - 1]
            z[i] = z[i - 1]
        elif step == "UP":
            x[i] = x[i - 1]
            y[i] = y[i - 1] + 1
            z[i] = z[i - 1]
        elif step == "DOWN":
            x[i] = x[i - 1]
            y[i] = y[i - 1] - 1
            z[i] = z[i - 1]
        elif step == "IN":
            x[i] = x[i - 1]
            y[i] = y[i - 1]
            z[i] = z[i - 1] - 1
        elif step == "OUT":
            x[i] = x[i - 1]
            y[i] = y[i - 1]
            z[i] = z[i - 1] + 1

    return x, y, z

x_data, y_data, z_data = randomwalk3D(1000)

ax = plt.subplot(1, 1, 1, projection='3d')
ax.plot(x_data, y_data, z_data, alpha=0.9)
ax.scatter(x_data[-1], y_data[-1], z_data[-1])

plt.show()
Conclusion
Today you learned how to implement random walk in Python in 1D, 2D, and 3D.
To recap, a random walk is a process where an object starts wandering by taking steps in random directions. This process is present in nature in many ways.
To implement a random walk algorithm in Python, initialize an object at a starting point and start moving it around in random directions n times.
To then visualize random walks with Python, store each location into a list and plot the locations.
- With a 1D random walk, you plot the 1D locations with respect to time to better visualize the 1D path.
- With 2D and 3D random walks, you plot all the (x, y) or (x, y, z) pairs into the graph to get the path of the object.
Thanks for reading.
Happy coding!